In order to display the live values of a module within a vehicle the user should select the module they would like to view the values for, open it and select “Live values”.
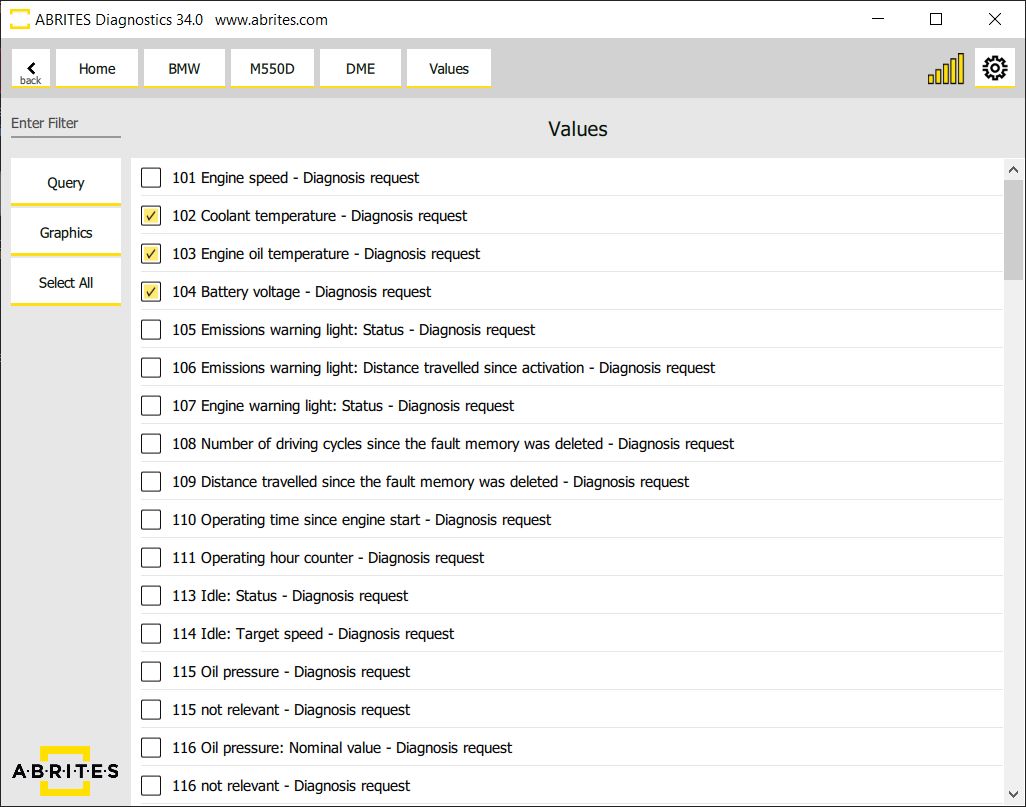
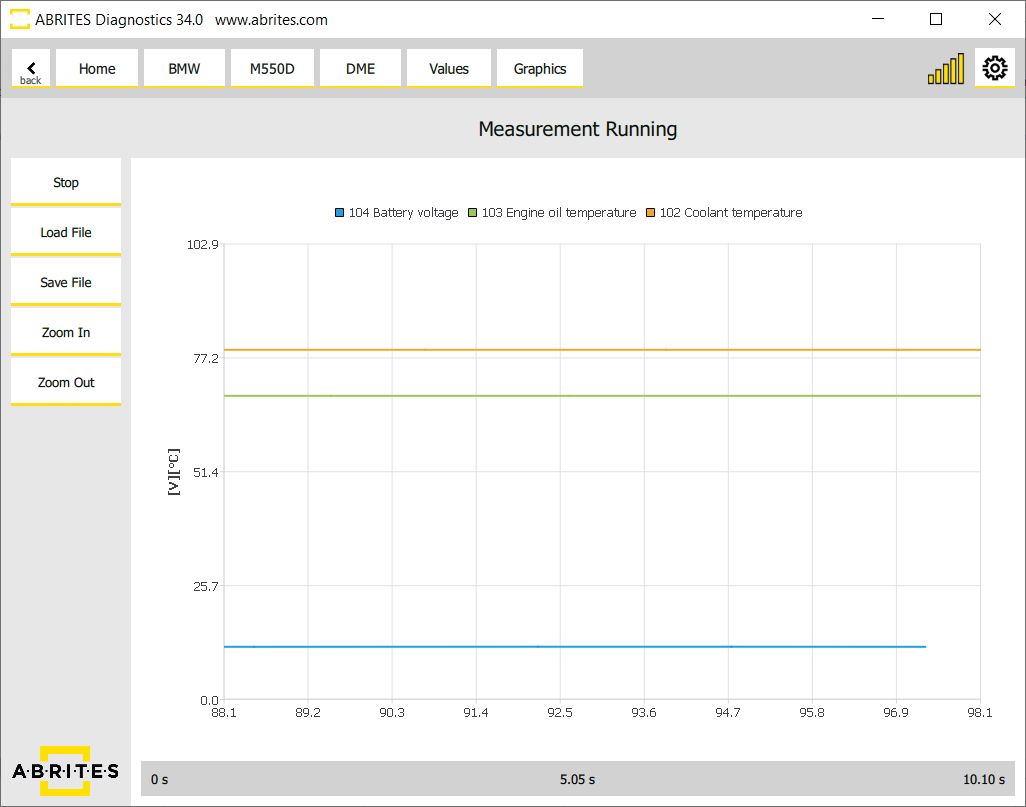
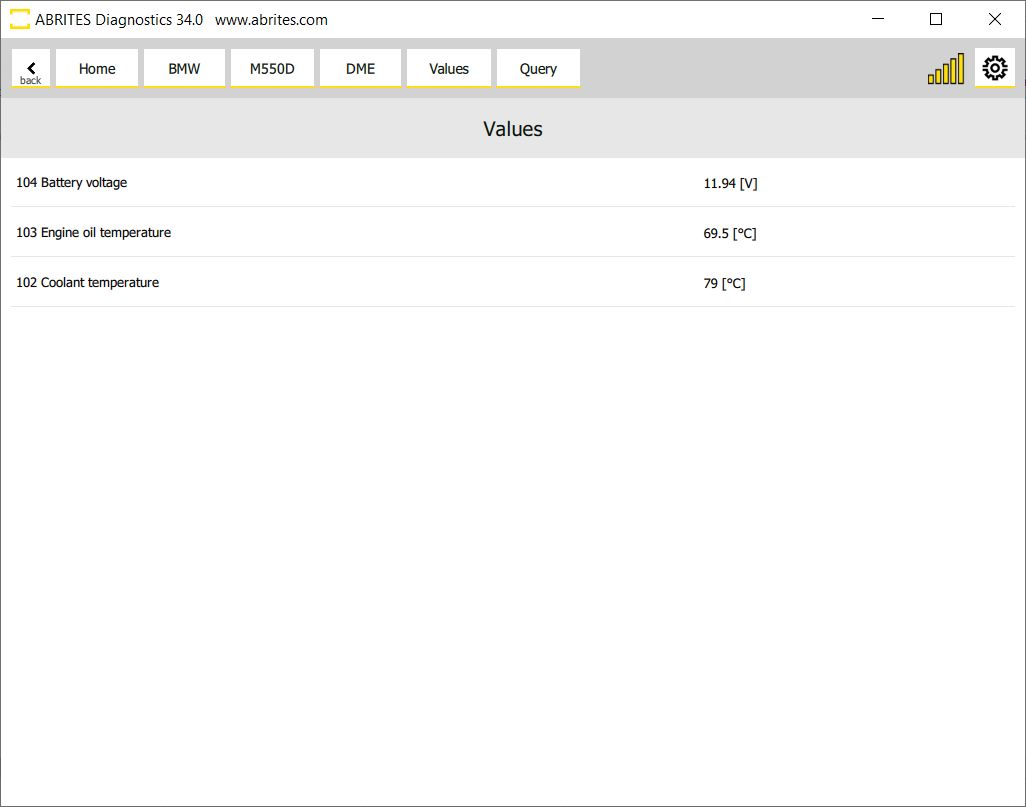
A list of all available values for the unit will be displayed. From here the user can select the sensors needed to be observed. Once that is done the user can select whether they would observe the values in a query form or a graphic form . This can be done for multiple sensors simultaneously. In case the user selects the option to view the measured values in a graphic form they will be able to see the screen below for all of the selected sensors. The simultaneous display of multiple values allows for easier and more detailed fault diagnostics.
The measured values can be monitored, saved to a file on the user’s computer, zoomed in for more detailed view or zoomed out for a more general view using the buttons on the side of the window. The user also has the ability to load a previously saved file for direct comparison.